I led a three-person team through task allocation and report integration, and personally built the charts and the dashboard below.
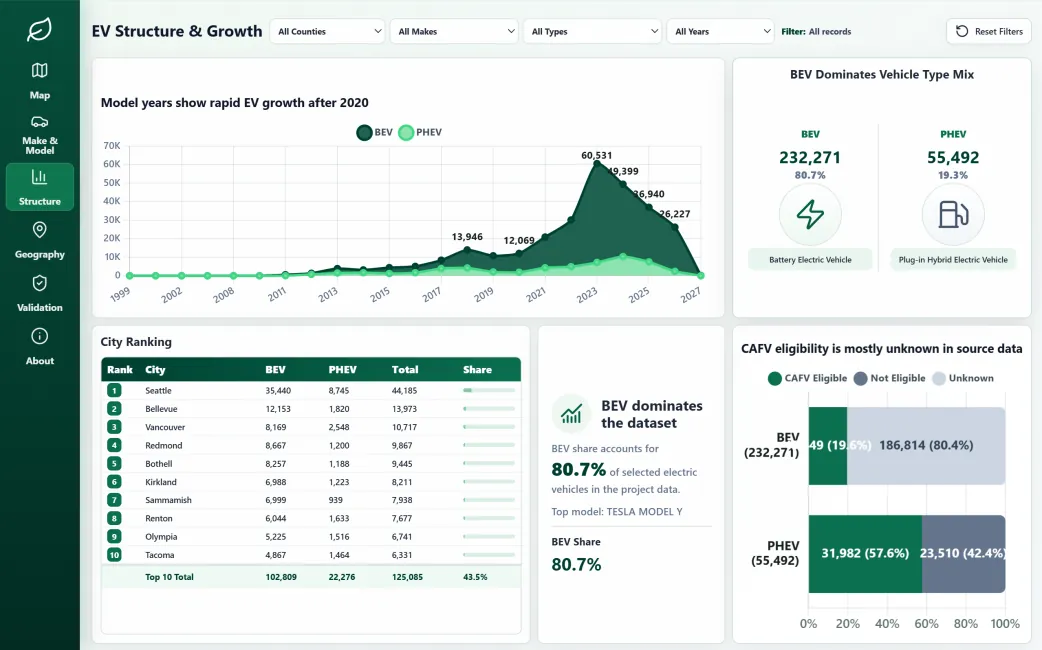
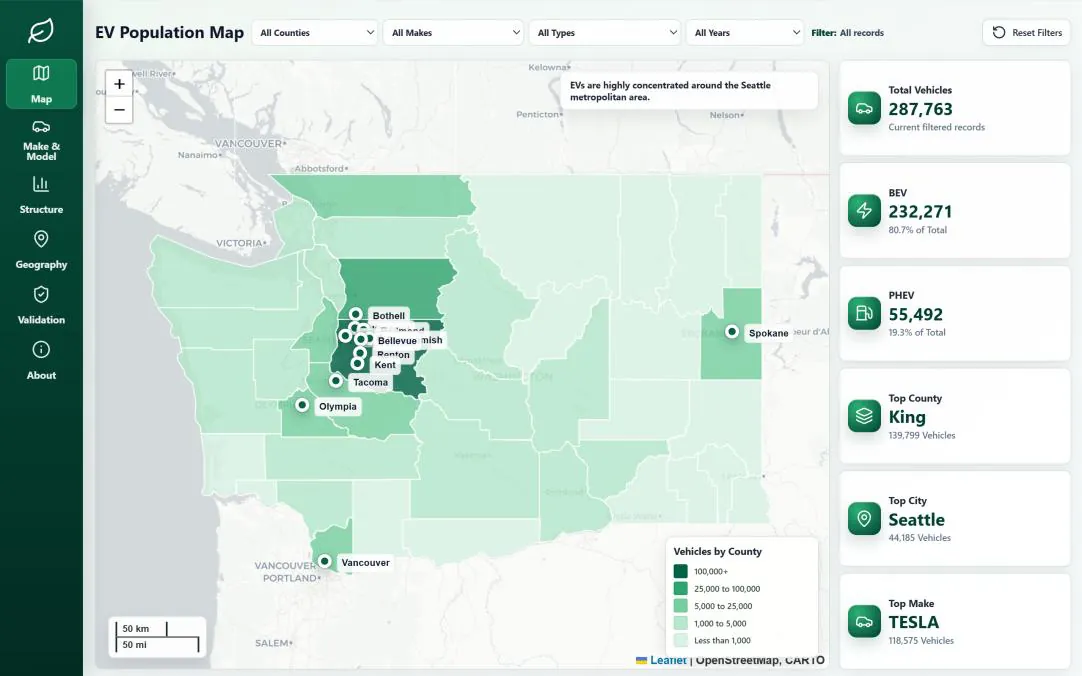
Seattle: 44,185 vehicles
232,271 BEV vs 55,492 PHEV
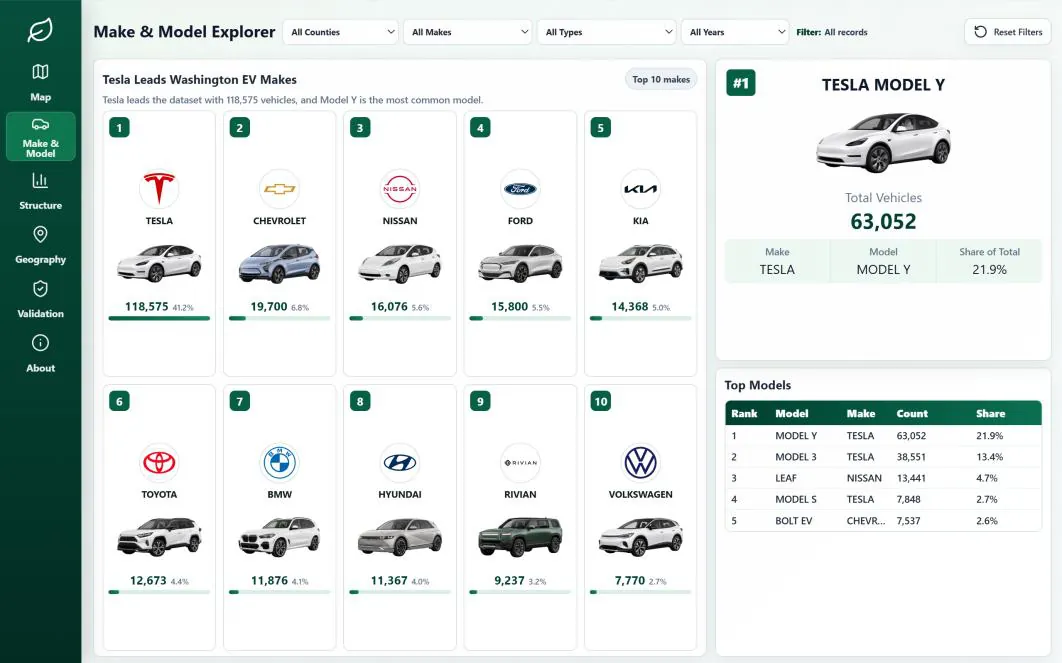
Tesla: 118,575 vehicles
Model Y and Model 3 lead
King County: 139,799 vehicles
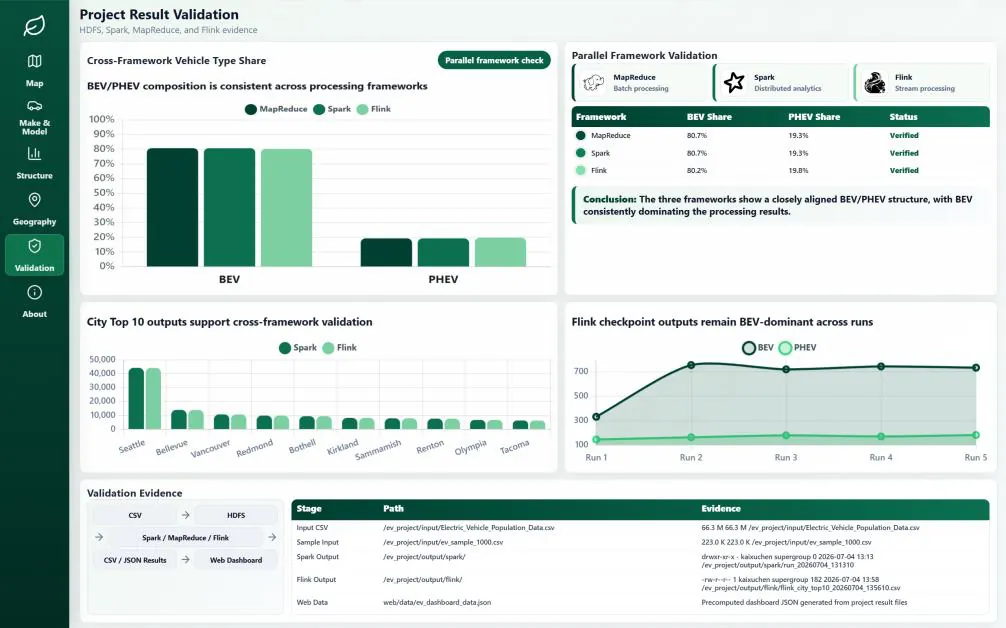
Top-10 city counts matched exactly across Spark, MapReduce and a simulated Flink stream.
| # | City | Spark | Flink | Diff |
|---|---|---|---|---|
| 1 | Seattle | 44,185 | 44,185 | 0 |
| 2 | Bellevue | 13,973 | 13,973 | 0 |
| 3 | Vancouver | 10,717 | 10,717 | 0 |
| 4 | Redmond | 9,867 | 9,867 | 0 |
| 5 | Bothell | 9,445 | 9,445 | 0 |
| 6 | Kirkland | 8,211 | 8,211 | 0 |
| 7 | Sammamish | 7,938 | 7,938 | 0 |
| 8 | Renton | 7,677 | 7,677 | 0 |
| 9 | Olympia | 6,741 | 6,741 | 0 |
| 10 | Tacoma | 6,331 | 6,331 | 0 |